The Solar Energy Industries Association and Benchmark Mineral Intelligence released the Q2 2026 edition of the US Energy Storage Market Outlook on May 20. The headline number: 9.7 GWh of new storage capacity was installed in Q1 2026, the largest first quarter on record and up 32% year-over-year. The segment breakdown is where the story sharpens.
The segment mix
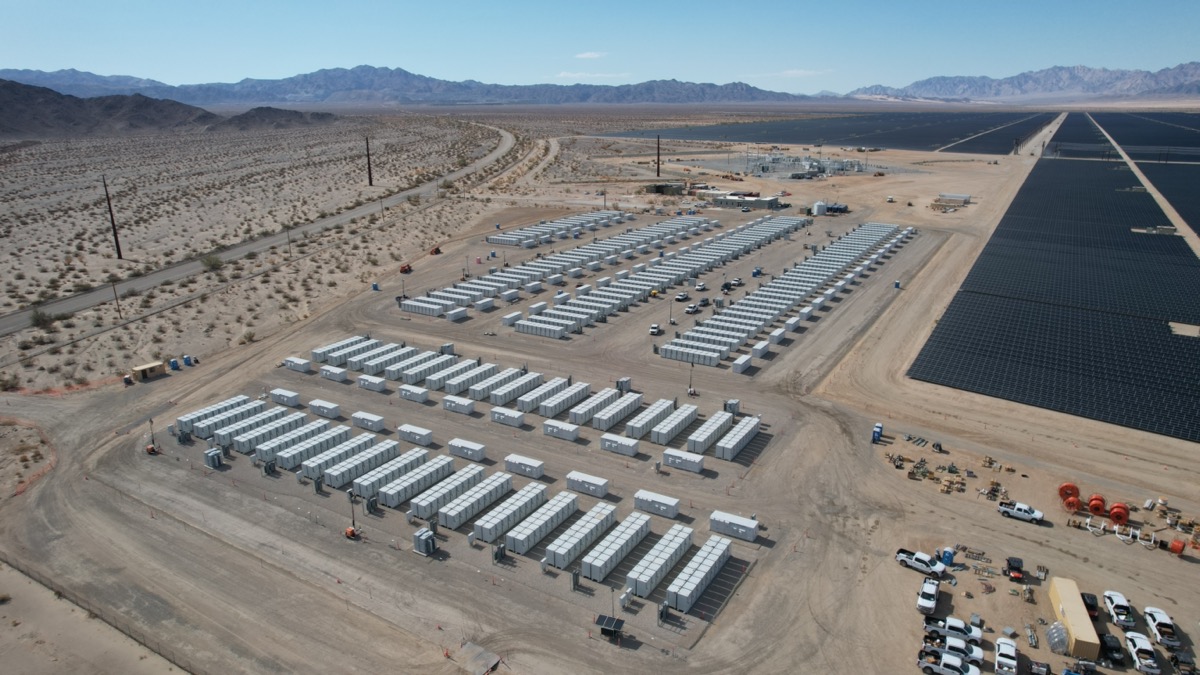
- Utility-scale: 7.8 GWh installed in Q1. That is roughly 80% of the quarter’s GWh and continues a multi-year pattern where front-of-the-meter projects drive almost all the GWh.
- Commercial and industrial: 648 MWh. Small in absolute terms; the C&I segment has been the slowest of the three to scale because customer-side economics depend heavily on tariff structures and demand-charge regimes that vary state by state.
- Residential: 515 MWh. Concentrated in California (where NEM 3.0 has pushed new solar customers toward paired storage to recover bill savings) and in Texas, Florida, and the Carolinas (where resilience after recent storm seasons is the buying driver, not arbitrage math).
The 32% YoY growth came against tougher comparables than the prior two quarters and despite policy headwinds that include ongoing investigations into Section 201 safeguard tariffs on lithium-ion cells, IRA technology-neutral tax credit guidance still being finalized, and rising interconnection delays across major ISOs.
The state map
Texas, Arizona, and California led utility-scale installs in Q1, in that order. The number worth reading carefully is from the SEIA release: 71% of Q1 utility-scale installations occurred in states with Republican-controlled state governments. Texas alone is on track for roughly 12.9 GW of additions across full-year 2026 per EIA’s plant developer survey, about 53% of planned new US battery storage capacity for the year. Arizona is at roughly 3.2 GW and California at 3.4 GW.
That distribution is not what the 2022-era narrative around the Inflation Reduction Act predicted. The IRA’s technology-neutral storage credit was designed at the federal level and applies uniformly. The actual deployment is going where load growth, interconnection availability, and project siting timelines are most permissive, which has turned out to be ERCOT (its own grid, no FERC interconnection process to negotiate), the Arizona desert (high solar capacity factor, fast permitting), and the California IOUs (capacity procurement mandates plus high wholesale prices in the duck-curve evening ramp).
The political asymmetry matters for two reasons. First, it complicates any near-term federal effort to roll back storage incentives: the constituencies most affected by a rollback are in states whose congressional delegations are not natural advocates for clean energy but are natural advocates for in-district manufacturing, jobs, and grid reliability. Second, it shifts the lobbying coalition. The storage trade groups now include developers building in Texas and Arizona, not just California IPPs and merchant developers. That broadens the political base.
The demand driver
The reason 2026 is a record year is not subsidy generosity. The IRA storage credit has been in place since 2023 and the rate of installations has accelerated since, not slowed. The reason is that demand for firm, dispatchable capacity adjacent to AI data center load has compressed project economics into a much shorter payback window than typical merchant storage.
Google and Meta both announced multi-thousand-megawatt-hour offtake deals earlier this year. Microsoft’s nuclear and storage procurement strategy, which has been visible in the Three Mile Island and Constellation deals, is the same playbook on a longer timeline. When a hyperscaler signs a 15-year storage tolling agreement at a fixed capacity payment, the project moves from merchant economics (where it competes against gas peakers on the spot market) to contracted economics (where the offtake covers debt service and equity returns without depending on day-ahead price volatility).
That changes which projects get built and where. Storage near interconnection-constrained ERCOT load zones (Houston, Dallas-Fort Worth, the Permian) goes from marginal to highly bankable when a 200 MW data center is the offtaker. Storage in Arizona near Phoenix’s data center corridor (Goodyear, Mesa, Chandler) is in the same category.
What this does to the forecast
SEIA revised its 2030 cumulative deployment forecast upward to more than 610 GWh in this report. EIA’s separate developer survey projects 24 GW of utility-scale storage in 2026 alone, compared with 15 GW added in 2025. The numbers are not perfectly comparable (SEIA reports GWh, EIA reports GW nameplate), but both point in the same direction: the run-rate is accelerating, not stabilizing.
The constraints on that forecast are now physical and procedural, not demand-side:
- Interconnection queue position. Projects in MISO and PJM queues are still seeing 4-7 year waits. ERCOT moves faster but is now adding queue depth from its own demand surge.
- Battery cell supply. Q1 imports of Chinese LFP cells continued despite Section 301 review pressure. A meaningful tariff escalation would tighten supply quickly; domestic cell production (the LG Energy Solution Arizona plant, the Samsung SDI Indiana plant, the SK On Georgia expansion) is ramping but not yet at the scale needed to displace imports.
- Interconnection equipment. Lead times for the 138 kV and 230 kV step-up transformers used in utility-scale storage projects have stretched to 18-30 months at the major OEMs (Hitachi Energy, Siemens Energy, GE Vernova). That is the real near-term throttle for many projects, not module or cell cost.
Positioning notes
- Storage developers with secured interconnection in ERCOT and Arizona hold the most valuable positions in the market right now. Those queue spots are not easily replicable for new entrants.
- Hyperscaler-aligned storage is no longer a niche category. The capacity contracts being signed now will set the merchant-vs-contracted ratio in the market for the next decade.
- Domestic cell manufacturers are positioned for upside in any tariff-escalation scenario. The risk is that scenario gets priced in before fundamentals catch up.
- Transformer and switchgear OEMs are the unglamorous beneficiaries. Equipment lead times are the binding constraint that no policy lever fixes quickly.
The frame: storage is no longer a forecast story. It is a deployment story, and the deployment is concentrated in places federal policy is least able to control. Whether the 2030 forecast lands at 610 GWh or higher is now a function of physical bottlenecks, not policy ones. That makes it a more boring story and a more durable one.
Sources
- Solar Energy Industries Association and Benchmark Mineral Intelligence, US Energy Storage Market Outlook Q2 2026, released May 20, 2026.
- US Energy Information Administration, New US electric generating capacity expected to reach a record high in 2026, eia.gov/todayinenergy/detail.php?id=67205.
- Electrek coverage of the SEIA report, May 20, 2026, electrek.co/2026/05/20/seia-ai-is-fueling-a-massive-us-energy-storage-boom.